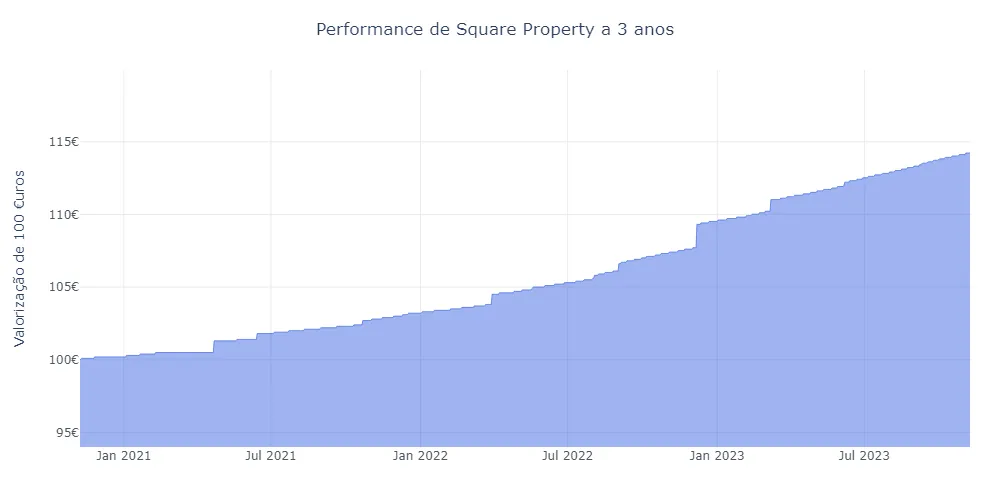
Tabela de Performance
| CAGR | STDDEV | SHARPE | MAX_DD | |
|---|---|---|---|---|
| S.I. | 4.18% | 1.05% | 3.97 | -0.2% |
| YTD | 4.3% | 0.85% | 5.93 | 0.0% |
| 1 Year | 6.34% | 1.51% | 4.18 | 0.0% |
| 3 Years | 4.53% | 1.09% | 4.17 | 0.0% |
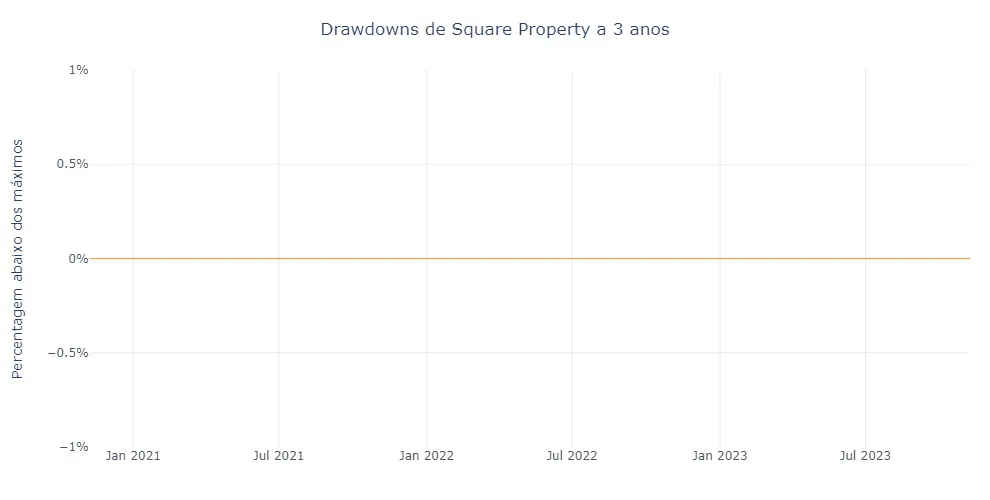
Tabela de Drawdowns
| Inicio | Fim | Profundidade | Período |
|---|---|---|---|
| 2020-09-09 | 2020-11-26 | -0.2% | 0 Years, 2 Months, 17 Days |
| 2020-08-28 | 2020-08-29 | 0.0% | 0 Years, 0 Months, 1 Days |
| 2022-10-09 | 2022-10-10 | 0.0% | 0 Years, 0 Months, 1 Days |
| 2022-10-10 | 2022-10-11 | 0.0% | 0 Years, 0 Months, 1 Days |
| 2022-10-11 | 2022-10-12 | 0.0% | 0 Years, 0 Months, 1 Days |
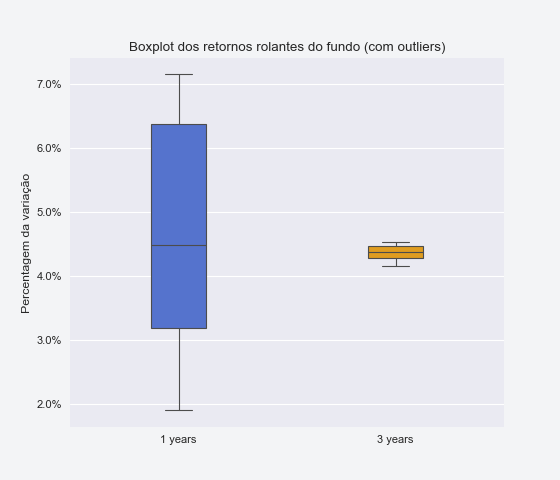
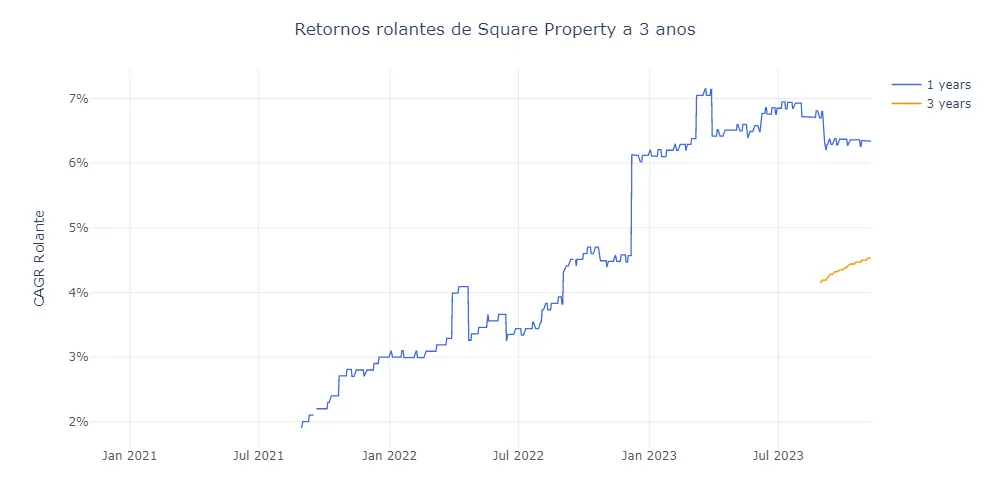
Box Plot de retornos rolantes