Tabela de Performance
| CAGR | STDDEV | SHARPE | MAX_DD | |
|---|---|---|---|---|
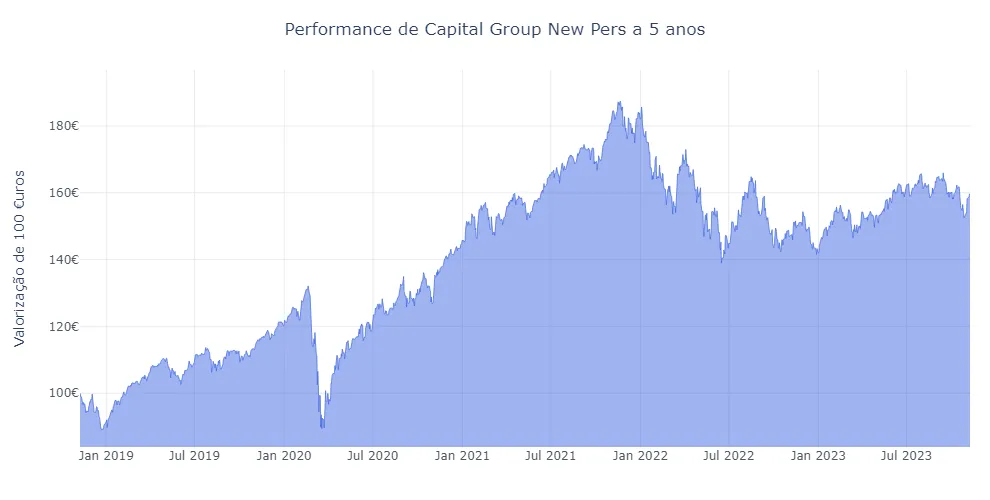
| S.I. | 8.81% | 14.01% | 0.63 | -32.32% |
| YTD | 12.28% | 10.71% | 1.35 | -8.14% |
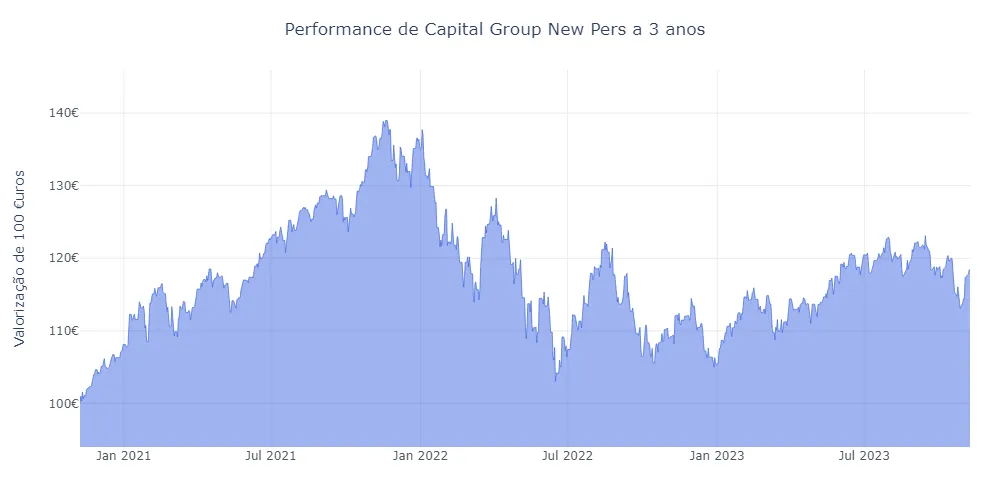
| 1 Year | 8.19% | 11.27% | 0.72 | -8.29% |
| 3 Years | 5.79% | 13.42% | 0.43 | -25.85% |
| 5 Years | 9.8% | 15.61% | 0.63 | -32.32% |
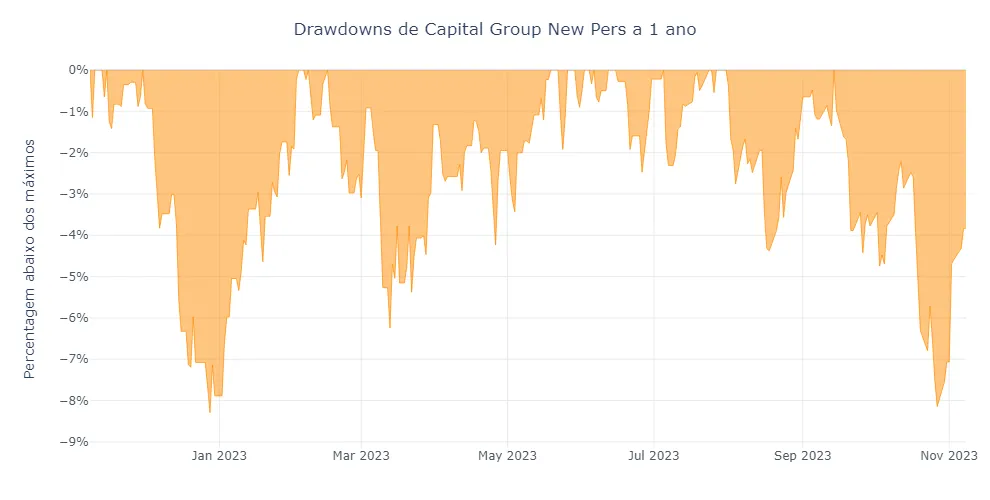
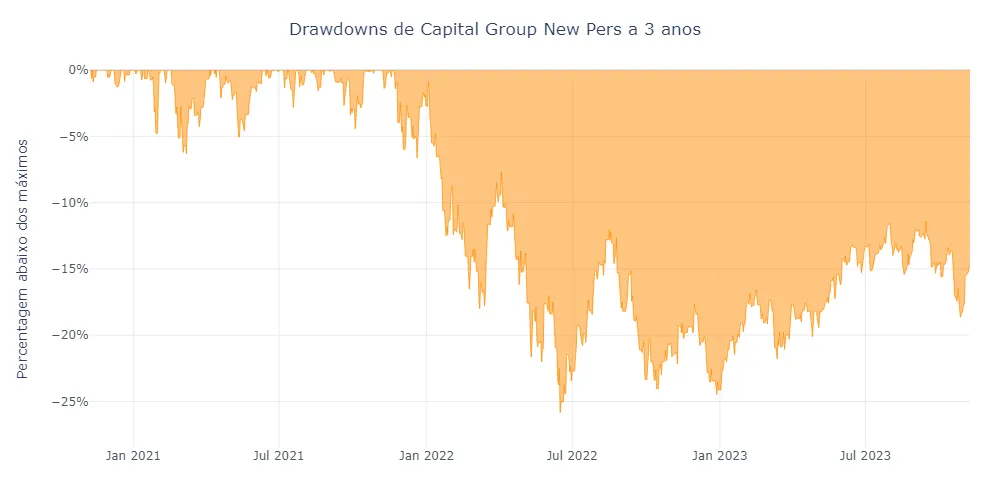
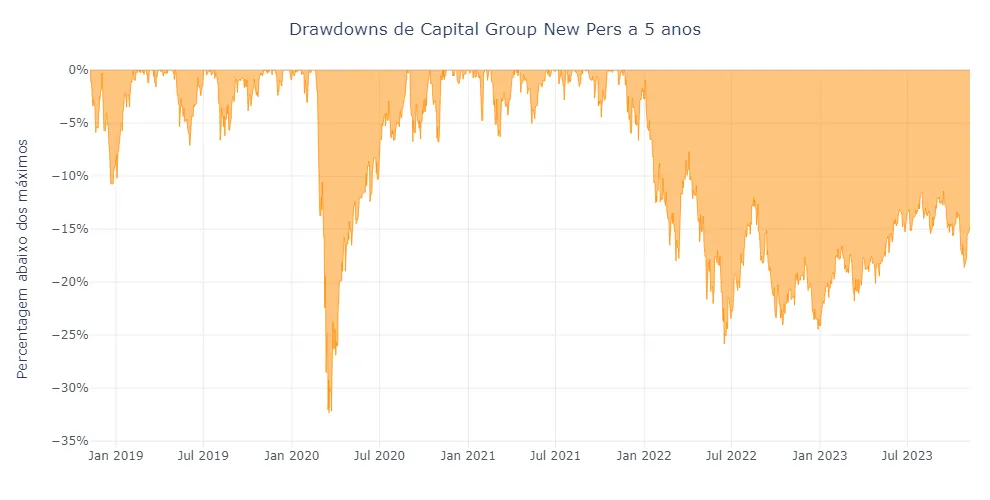
Tabela de Drawdowns
| Inicio | Fim | Profundidade | Período |
|---|---|---|---|
| 2020-02-19 | 2020-08-26 | -32.32% | 0 Years, 6 Months, 7 Days |
| 2021-11-21 | N/A | -25.85% | 2 Years, -1 Months, 18 Days |
| 2015-12-02 | 2016-12-15 | -21.07% | 1 Years, 0 Months, 13 Days |
| 2018-08-15 | 2019-03-19 | -14.93% | 0 Years, 7 Months, 4 Days |
| 2018-01-23 | 2018-05-09 | -7.62% | 0 Years, 3 Months, 16 Days |
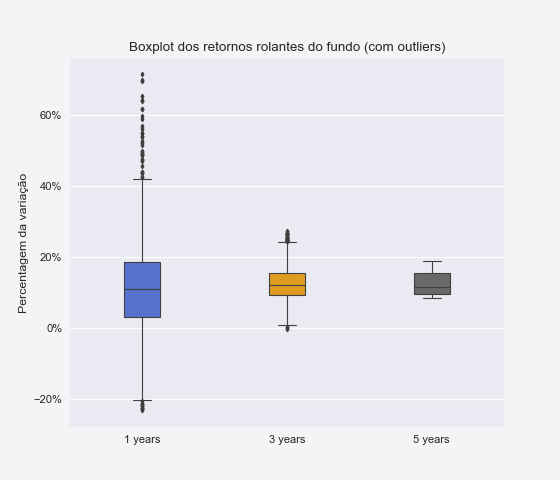
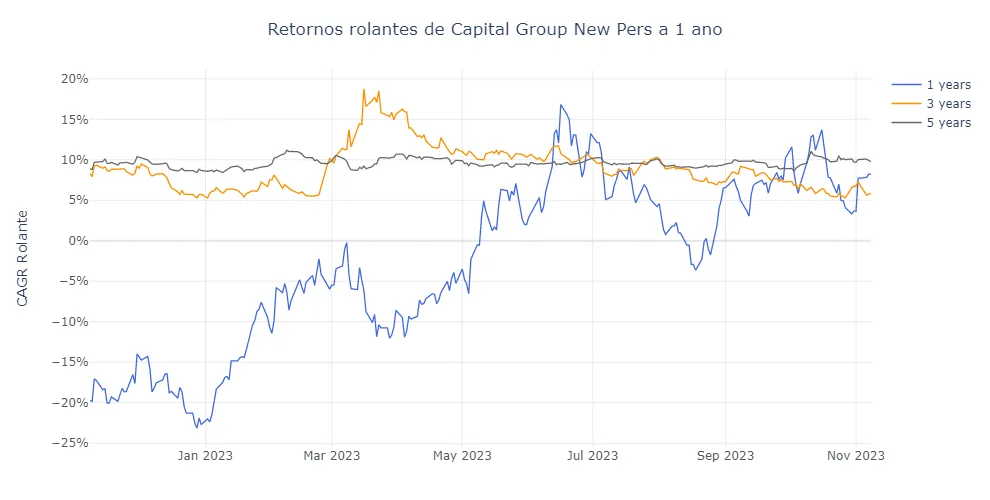
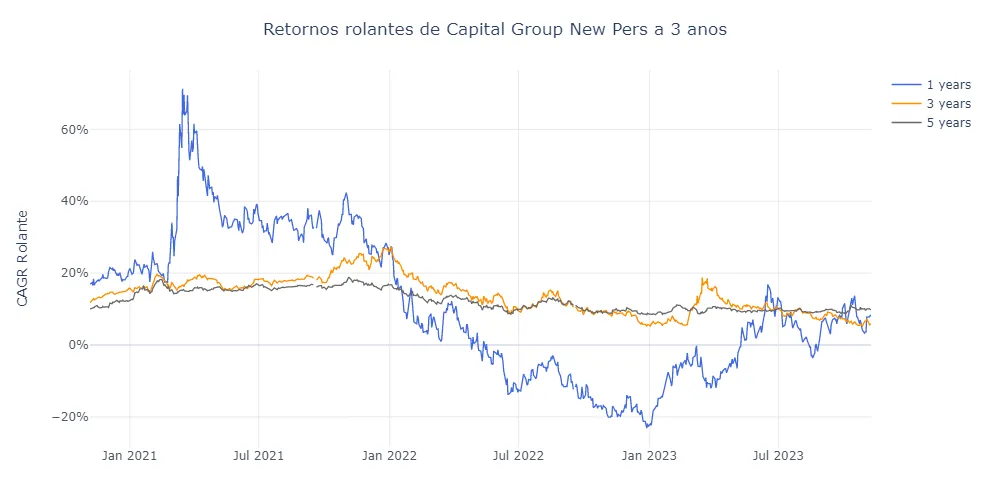
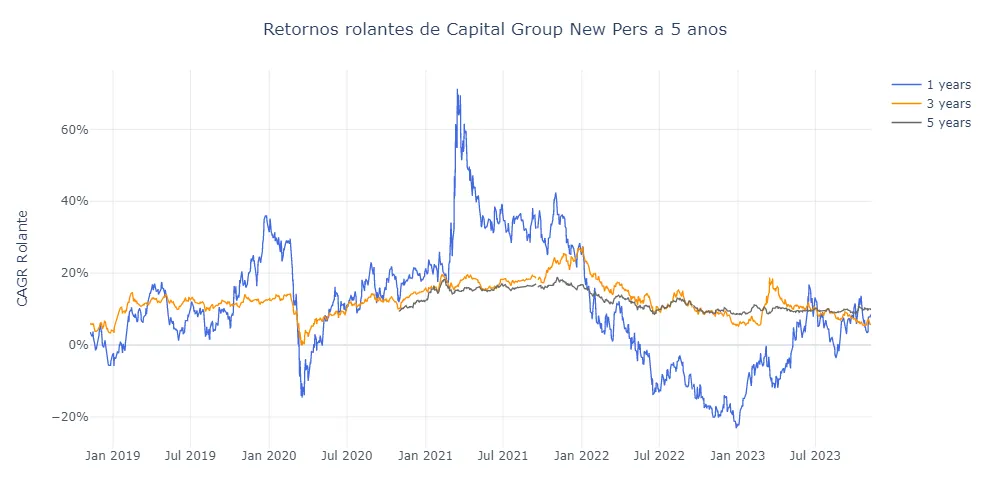
Box Plot de retornos rolantes