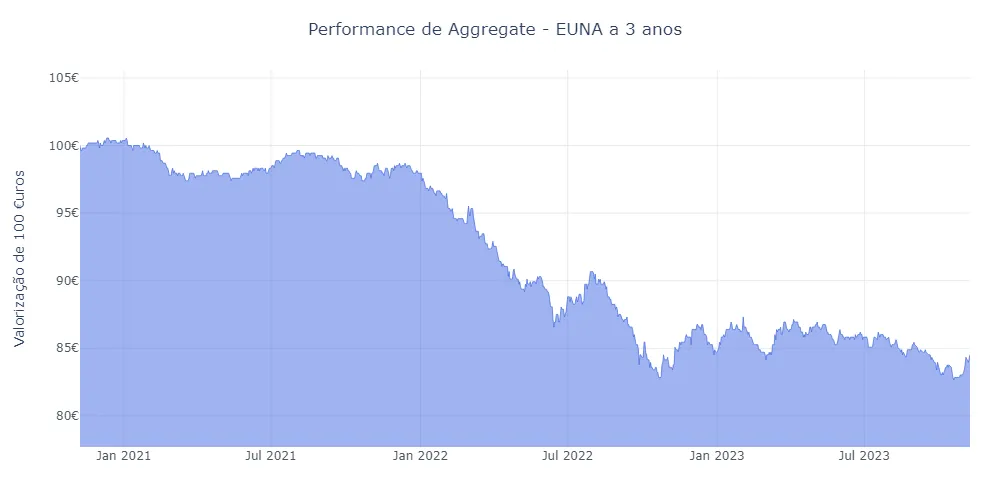
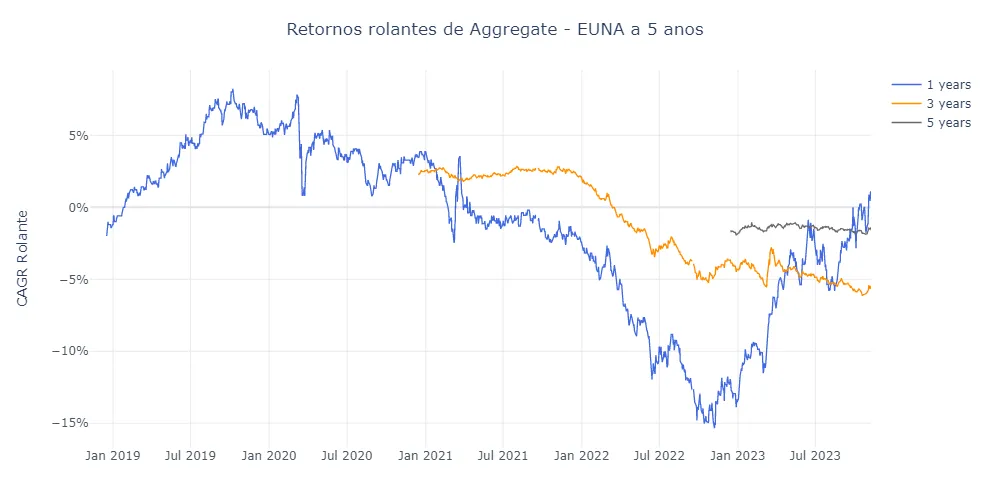
Tabela de Performance
| CAGR | STDDEV | SHARPE | MAX_DD | |
|---|---|---|---|---|
| S.I. | -1.72% | 3.84% | -0.45 | -17.81% |
| YTD | -0.22% | 4.46% | -0.06 | -5.34% |
| 1 Year | 0.89% | 4.73% | 0.19 | -5.34% |
| 3 Years | -5.45% | 4.22% | -1.29 | -17.81% |
| 5 Years | -1.4% | 4.09% | -0.34 | -17.81% |
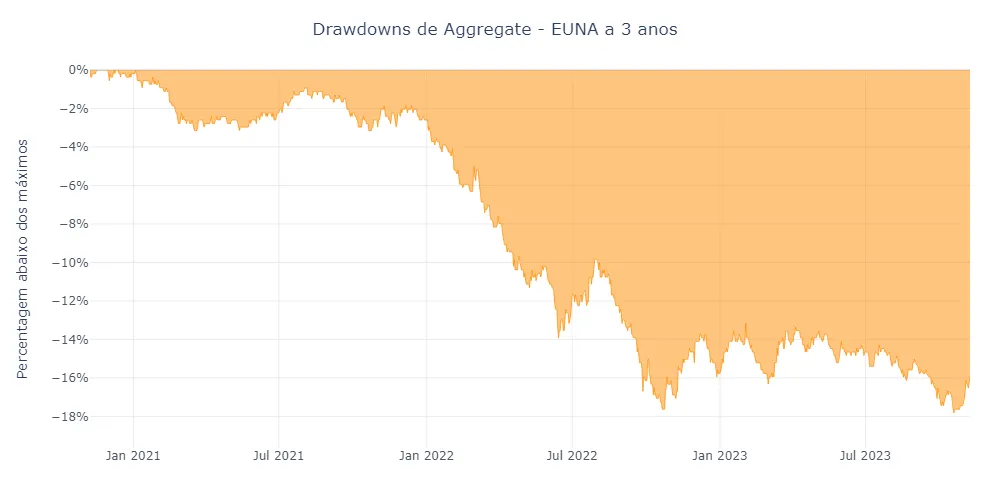
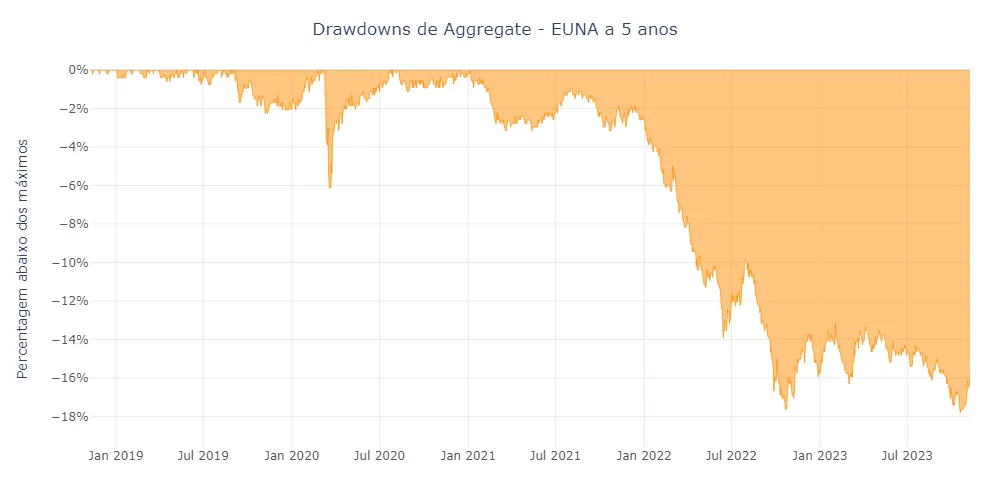
Tabela de Drawdowns
| Inicio | Fim | Profundidade | Período |
|---|---|---|---|
| 2021-01-04 | N/A | -17.81% | 2 Years, 10 Months, 4 Days |
| 2020-03-09 | 2020-07-23 | -6.13% | 0 Years, 4 Months, 14 Days |
| 2017-12-18 | 2019-03-21 | -3.19% | 1 Years, 3 Months, 3 Days |
| 2019-09-04 | 2020-02-24 | -2.27% | 0 Years, 5 Months, 20 Days |
| 2020-08-10 | 2020-12-11 | -1.11% | 0 Years, 4 Months, 1 Days |
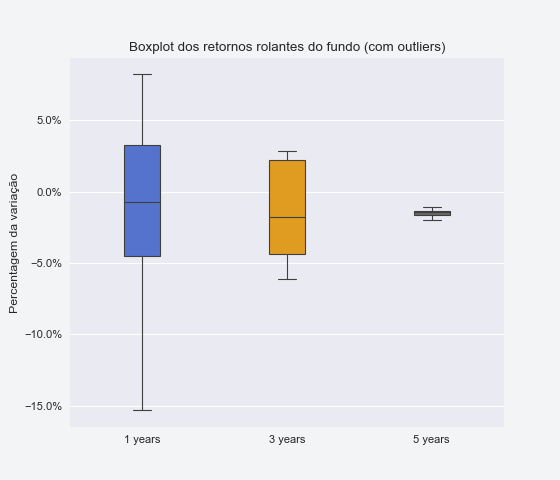
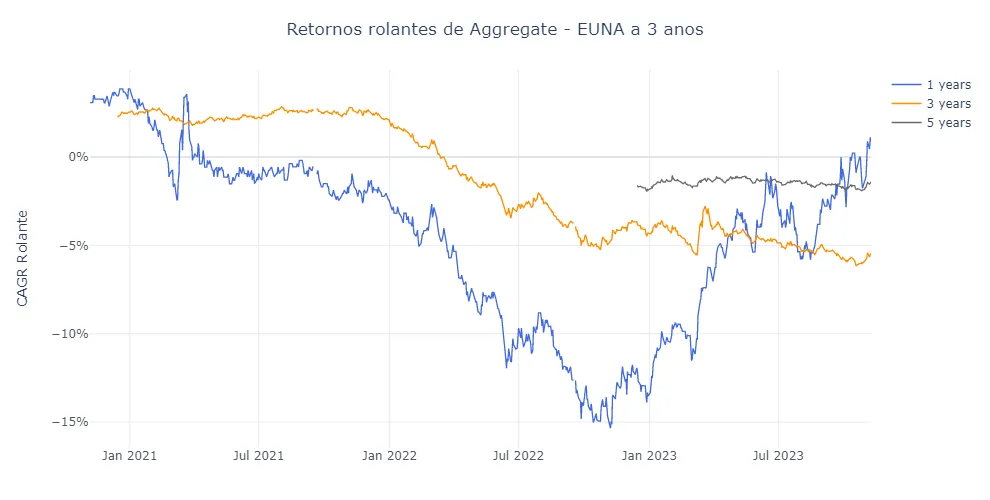
Box Plot de retornos rolantes