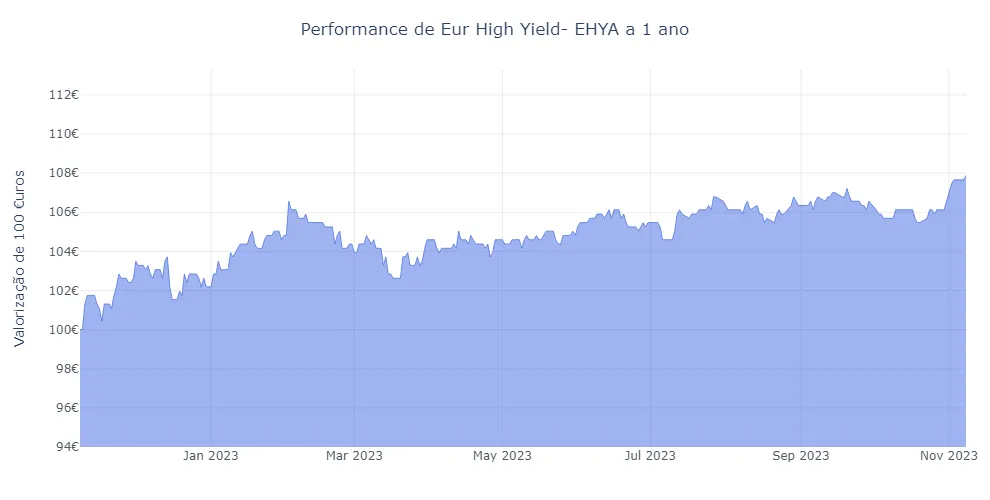
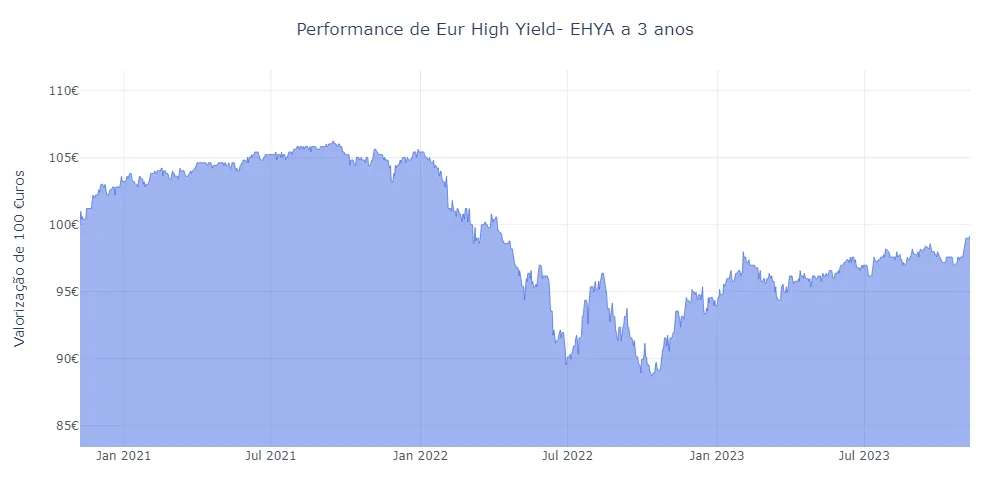
Tabela de Performance
| CAGR | STDDEV | SHARPE | MAX_DD | |
|---|---|---|---|---|
| S.I. | -0.45% | 8.82% | -0.05 | -24.66% |
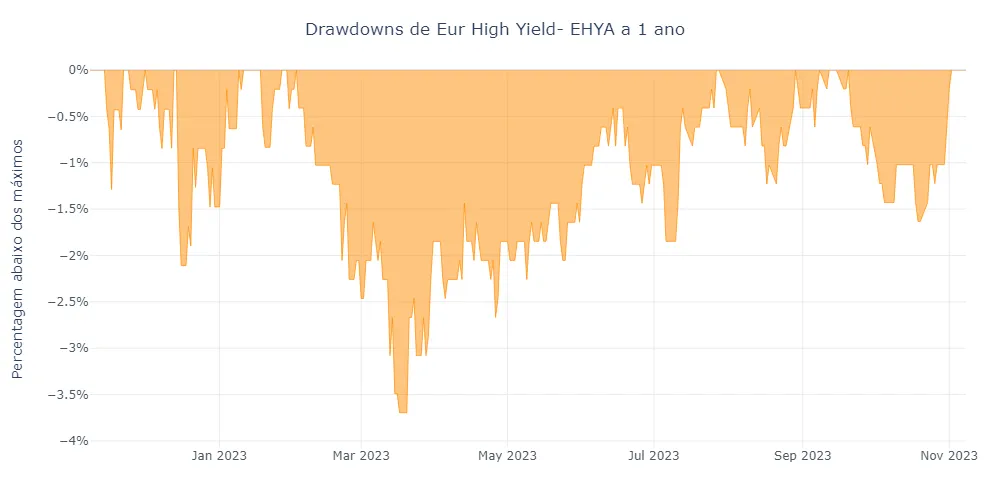
| YTD | 5.57% | 4.72% | 1.38 | -3.7% |
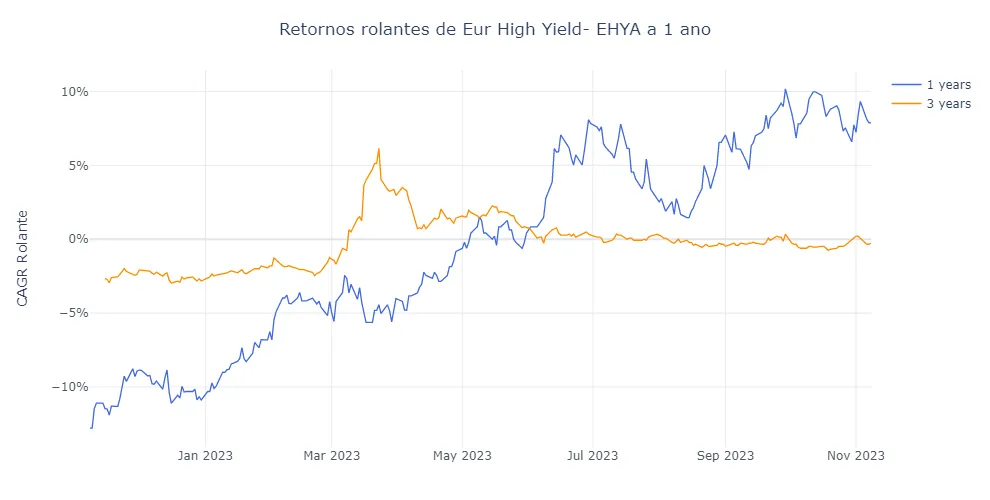
| 1 Year | 7.88% | 5.25% | 1.5 | -3.7% |
| 3 Years | -0.27% | 5.66% | -0.05 | -16.48% |
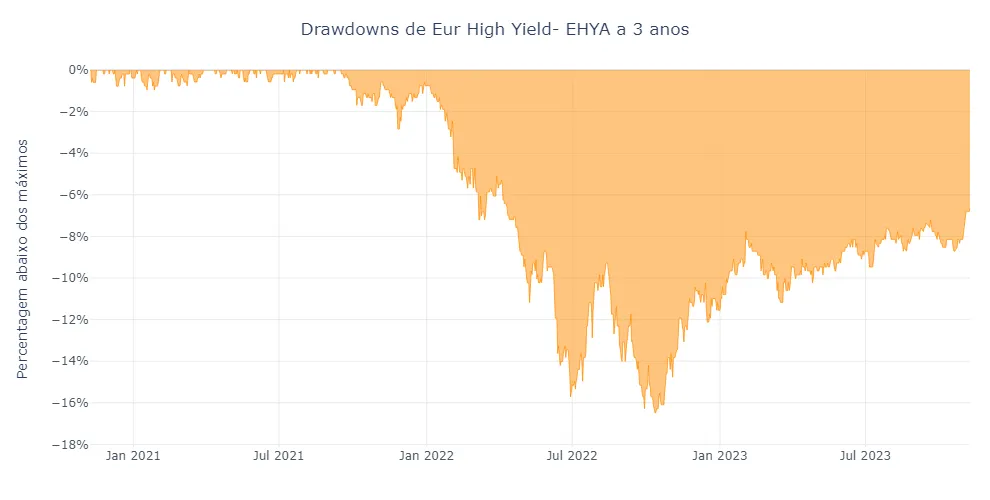
Tabela de Drawdowns
| Inicio | Fim | Profundidade | Período |
|---|---|---|---|
| 2020-02-20 00:00:00 | 2020-12-29 | -24.66% | 0 Years, 10 Months, 9 Days |
| 2021-09-16 02:09:36 | N/A | -16.48% | 2 Years, 1 Months, 23 Days |
| 2020-01-21 00:00:00 | 2020-02-07 | -0.98% | 0 Years, 0 Months, 17 Days |
| 2021-01-10 00:00:00 | 2021-02-03 | -0.97% | 0 Years, 0 Months, 24 Days |
| 2021-02-17 00:00:00 | 2021-03-11 | -0.77% | 0 Years, 0 Months, 24 Days |
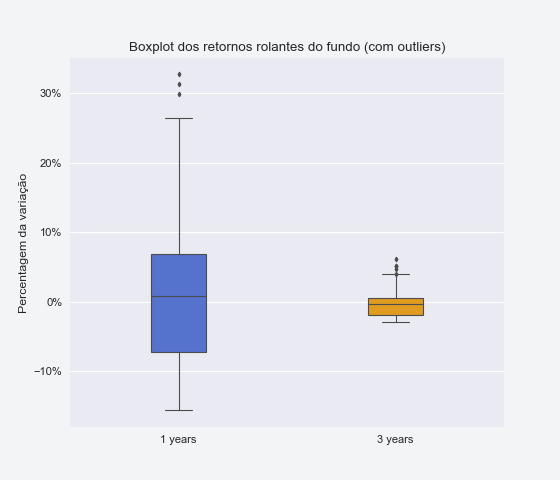
Box Plot de retornos rolantes